DATA. INSIGHT. GROWTH.
Turn Data Into
Business Decisions
That Drive Growth
Analytics is where we lead. We turn scattered spreadsheets and systems into a single source of truth your leadership team can act on. Need the underlying pipelines built or predictive models trained first? Our data engineering and data science teams handle that too.
POWERED BY LEADING DATA & ANALYTICS PLATFORMS
Data Engineering
Build. Integrate. Store.
Data Analytics
Transform. Analyze. Uncover Insights.
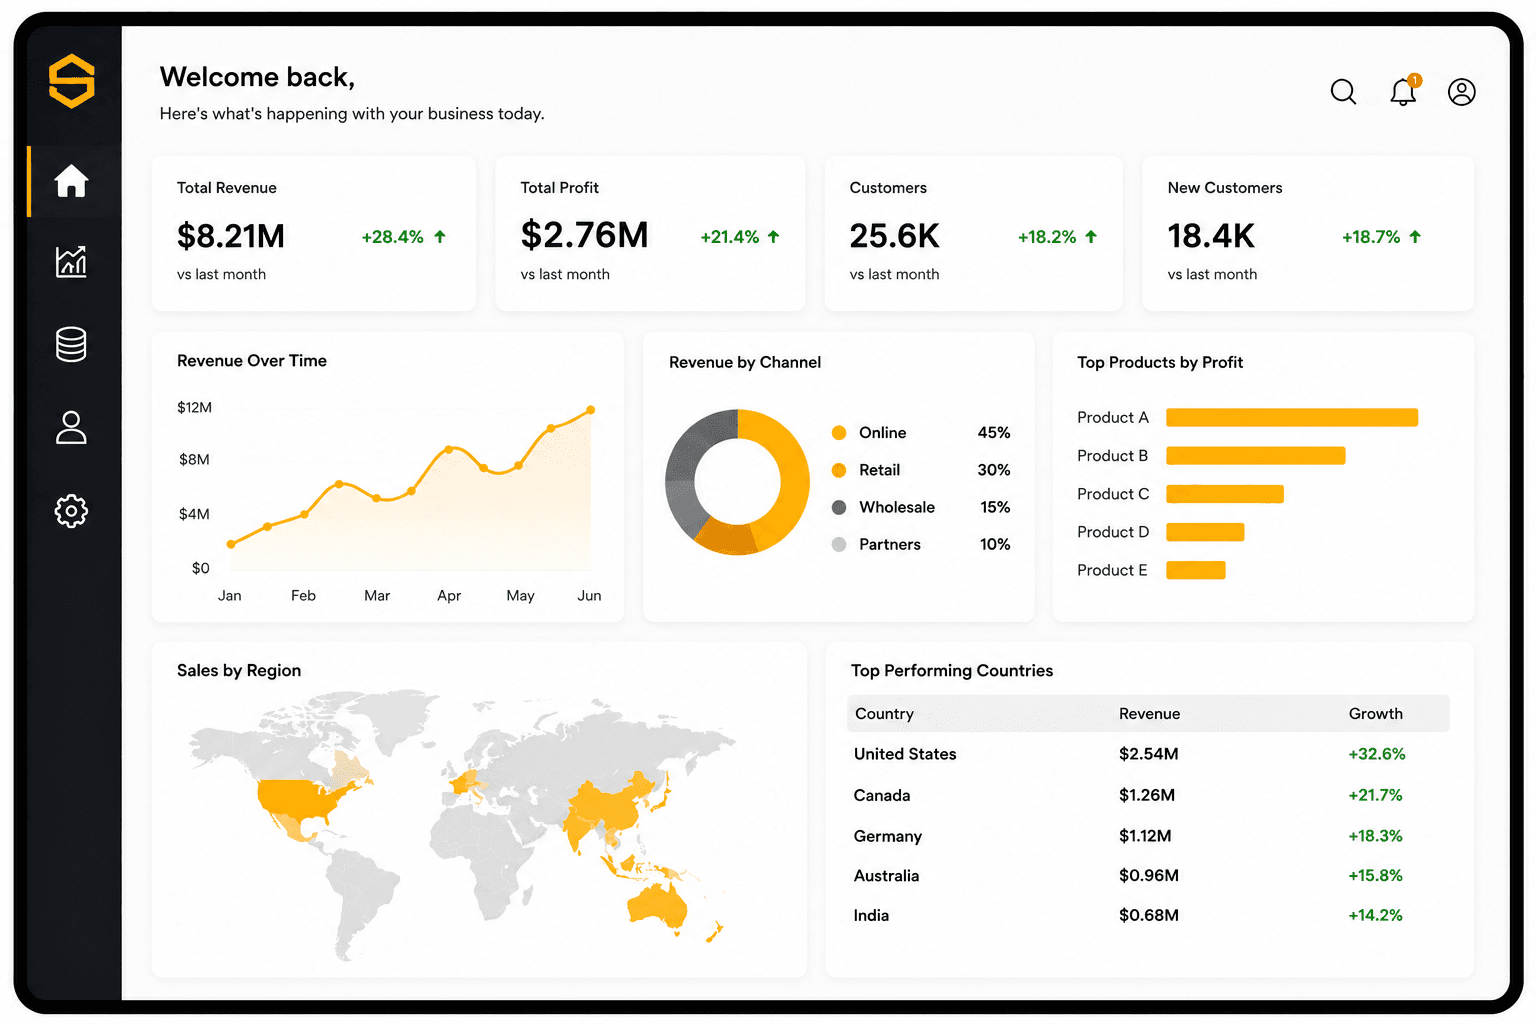
Executive Dashboard
Visualize. Track. Make Decisions.
Business Growth
Smarter Decisions.
Better Outcomes.
Stronger Growth.
OUR CORE EXPERTISE
Data Analytics Is Our Core Strength
Everything we build starts with a question your team is trying to answer. Data engineering and data science are how we get you a good answer. Analytics is where we actually deliver it.
Data Engineering
Clean, connected data pipelines so your reports are never built on a shaky spreadsheet someone patched together last quarter.
- ETL / ELT Pipelines
- Cloud Pipelines
- Data Warehousing
- Data Migration
- Data Integration
- Data Governance
- Data Modeling
- Data Quality
- SQL Development
- API & Integration
Data Analytics
Power BI dashboards, executive KPI tracking and self-service reporting that replace guesswork with a number everyone in the room agrees on.
- KPI Development
- Business Intelligence
- Executive Dashboards
- Data Visualization
- Power BI Development
- Ad-hoc Reporting
- Report Automation
- Self-Service Analytics
- Dashboard Design
- Performance Tracking
Data Science
Forecasting and machine learning models that push your analytics past reporting on last quarter and into predicting the next one.
- Predictive Analytics
- AI Automation
- Machine Learning
- NLP
- Forecasting
- Time Series Analysis
- Customer Segmentation
- Model Deployment
- Recommendation Systems
- Statistical Analysis
DRIVE IMPACT WITH ANALYTICS
Actionable Insights.
Measurable Impact.
- Real-time visibility across your business
- KPIs that align with your goals
- Insights that lead to confident decisions
- Dashboards your team will love to use
Results Our Data Analytics Clients See
95%
Faster Reporting
See reports every week
40%
Time Saved
Automate and focus on what matters
3x
Decision Speed
Make data-backed decisions faster
Ready to Unlock the Power of Your Data?
Let's build a data foundation and analytics system that drives real growth for your business.
OUR PROCESS
From Data to Decisions in 7 Simple Steps
1. Discover
Understand your business goals
2. Collect
Gather data from multiple sources
3. Engineer
Build reliable data pipelines
4. Transform
Clean, validate & structure data
5. Analyze
Build KPIs and uncover insights
6. Visualize
Create dashboards that drive action
7. Optimize
Continuously improve and measure impact
INDUSTRIES WE SERVE
Data Analytics Expertise Built Around Your Industry
The right dashboard for a hospital isn't the right dashboard for a logistics fleet. We build analytics around how your industry actually makes decisions.
Hover or tab into a card for how we approach it.
Patient records, scheduling, and billing usually live in separate systems that don't talk to each other. We build dashboards that bring them together into KPIs your team can actually track, from bed utilization to appointment no-show rates, and forecasting models for things like patient flow once the reporting layer is solid.
Financial data comes with tight accuracy and audit requirements, and pipelines built for other industries usually cut corners here. We build ETL processes with validation and reconciliation built in, then dashboards on top so the numbers match before they reach a report.
Sales, inventory, and foot traffic data rarely sit in one place until someone builds the pipeline that connects them. We turn that into dashboards for stock levels and store performance, plus demand forecasting once you're ready to plan ahead instead of react.
Sensor data, production logs, and ERP records move at different speeds and in different formats on a factory floor. We build pipelines that bring them into one warehouse, so downtime and yield reporting reflect what's happening on the line, with predictive maintenance as a next step.
Customer behavior data piles up fast in e-commerce, but most of it never gets used past a basic sales dashboard. We build reporting on top of that data plus models for churn risk, product recommendations, and demand forecasting scoped to what you already collect.
Route data, delivery times, and fleet costs are usually tracked well enough to report on, but not well enough to predict. We build the pipelines to consolidate that data and forecasting models for demand and delivery windows that help plan capacity ahead of time.
Portfolio performance, occupancy, and pricing data often live in spreadsheets that get rebuilt every reporting cycle. We build dashboards that track these automatically, so a portfolio review doesn't start with a week of manual reconciliation.
Enrollment, attendance, and outcomes data are usually spread across systems that were never meant to talk to each other. We build reporting that brings them together, so administrators can track trends without exporting three spreadsheets to compare them.
Usage data is the most valuable asset most SaaS companies underuse. We build churn prediction and usage forecasting models on top of your existing product analytics, plus the KPI dashboards to track retention against, scoped to the questions your team is actually asking.
Metering and sensor data in energy come in high volume and often in formats that weren't built for analytics. We build pipelines that normalize that data, and demand forecasting on top of it once consumption reporting is something your team can trust.
Project costs, timelines, and change orders are usually tracked across separate tools per project, which makes portfolio-level reporting slow to assemble. We build pipelines that consolidate that data, so cost overruns and schedule risk show up before a project closes out.
Patient records, scheduling, and billing usually live in separate systems that don't talk to each other. We build dashboards that bring them together into KPIs your team can actually track, from bed utilization to appointment no-show rates, and forecasting models for things like patient flow once the reporting layer is solid.
Financial data comes with tight accuracy and audit requirements, and pipelines built for other industries usually cut corners here. We build ETL processes with validation and reconciliation built in, then dashboards on top so the numbers match before they reach a report.
Sales, inventory, and foot traffic data rarely sit in one place until someone builds the pipeline that connects them. We turn that into dashboards for stock levels and store performance, plus demand forecasting once you're ready to plan ahead instead of react.
Sensor data, production logs, and ERP records move at different speeds and in different formats on a factory floor. We build pipelines that bring them into one warehouse, so downtime and yield reporting reflect what's happening on the line, with predictive maintenance as a next step.
Customer behavior data piles up fast in e-commerce, but most of it never gets used past a basic sales dashboard. We build reporting on top of that data plus models for churn risk, product recommendations, and demand forecasting scoped to what you already collect.
Route data, delivery times, and fleet costs are usually tracked well enough to report on, but not well enough to predict. We build the pipelines to consolidate that data and forecasting models for demand and delivery windows that help plan capacity ahead of time.
Portfolio performance, occupancy, and pricing data often live in spreadsheets that get rebuilt every reporting cycle. We build dashboards that track these automatically, so a portfolio review doesn't start with a week of manual reconciliation.
Enrollment, attendance, and outcomes data are usually spread across systems that were never meant to talk to each other. We build reporting that brings them together, so administrators can track trends without exporting three spreadsheets to compare them.
Usage data is the most valuable asset most SaaS companies underuse. We build churn prediction and usage forecasting models on top of your existing product analytics, plus the KPI dashboards to track retention against, scoped to the questions your team is actually asking.
Metering and sensor data in energy come in high volume and often in formats that weren't built for analytics. We build pipelines that normalize that data, and demand forecasting on top of it once consumption reporting is something your team can trust.
Project costs, timelines, and change orders are usually tracked across separate tools per project, which makes portfolio-level reporting slow to assemble. We build pipelines that consolidate that data, so cost overruns and schedule risk show up before a project closes out.
ABOUT STACK HOMME
A Data Analytics Consultancy Built Around One Idea
Stack Homme helps teams that are tired of making calls off gut feel, a patchwork of spreadsheets, or a dashboard nobody quite trusts anymore.
Our core strength is analytics: Power BI dashboards, KPI tracking and reporting that gives a room full of people one number to agree on. When the underlying data needs cleaning up first, or when the next step is forecasting instead of reporting, our data engineering and data science teams handle that too.
We'd rather ship a dashboard that gets used every Monday than a slide deck that gets filed away after one meeting.
Start with the decision, not the dashboard
We ask what call you're trying to make before we open a design tool. A chart nobody needs is wasted work, however good it looks.
A dashboard nobody trusts is worse than no dashboard
If the numbers don't match reality, people go back to gut feel and blame the tool. We'd rather ship it right than ship it fast.
Engineering and data science exist to make analytics better
We don't sell pipelines or models for their own sake. They're there to make the dashboard you actually use more accurate.

Ready to Build a Smarter Data Strategy?
Book a free consultation and let our experts help you turn your data into a growth engine.
- Free Consultation
- Business Assessment
- Custom Solution Roadmap
- No Obligation